Systems Monitoring Standard
Version: 1, effective date: 01-Oct-2021
Contents
1 Standard description
This document will define the standard for monitoring T&T applications.
2 Document objectives and benefits
2.1 Objectives
Objectives of the document are:
-
Define the landscape of T&T applications.
-
Define monitoring scope for T&T applications.
-
Define monitoring visualization for a holistic overview of system status
2.2 Benefits
The document defines the following aspects of all T&T landscapes:
-
Identify status at glance on different levels and locations
-
The levels of monitoring and aggregation concepts
-
Prioritization of alerts
-
Incident registration and reaction policy
-
Define the framework for application-level monitoring
3 Definitions
T&T – Track & Trace
CI – Continuous Integration
4 Roles & Responsibilities
| # | Activity | GDC T&T | BTS T&T | TA |
|---|---|---|---|---|
| 1 | Define and maintain Standard | A/R | C | R |
| 2 | Apply the Standard in the T&T Implementation projects | A/R | I | R |
5 Monitoring overview
5.1 T&T Landscape
The diagram below shows the overall landscape of JTI Track and Trace solutions.
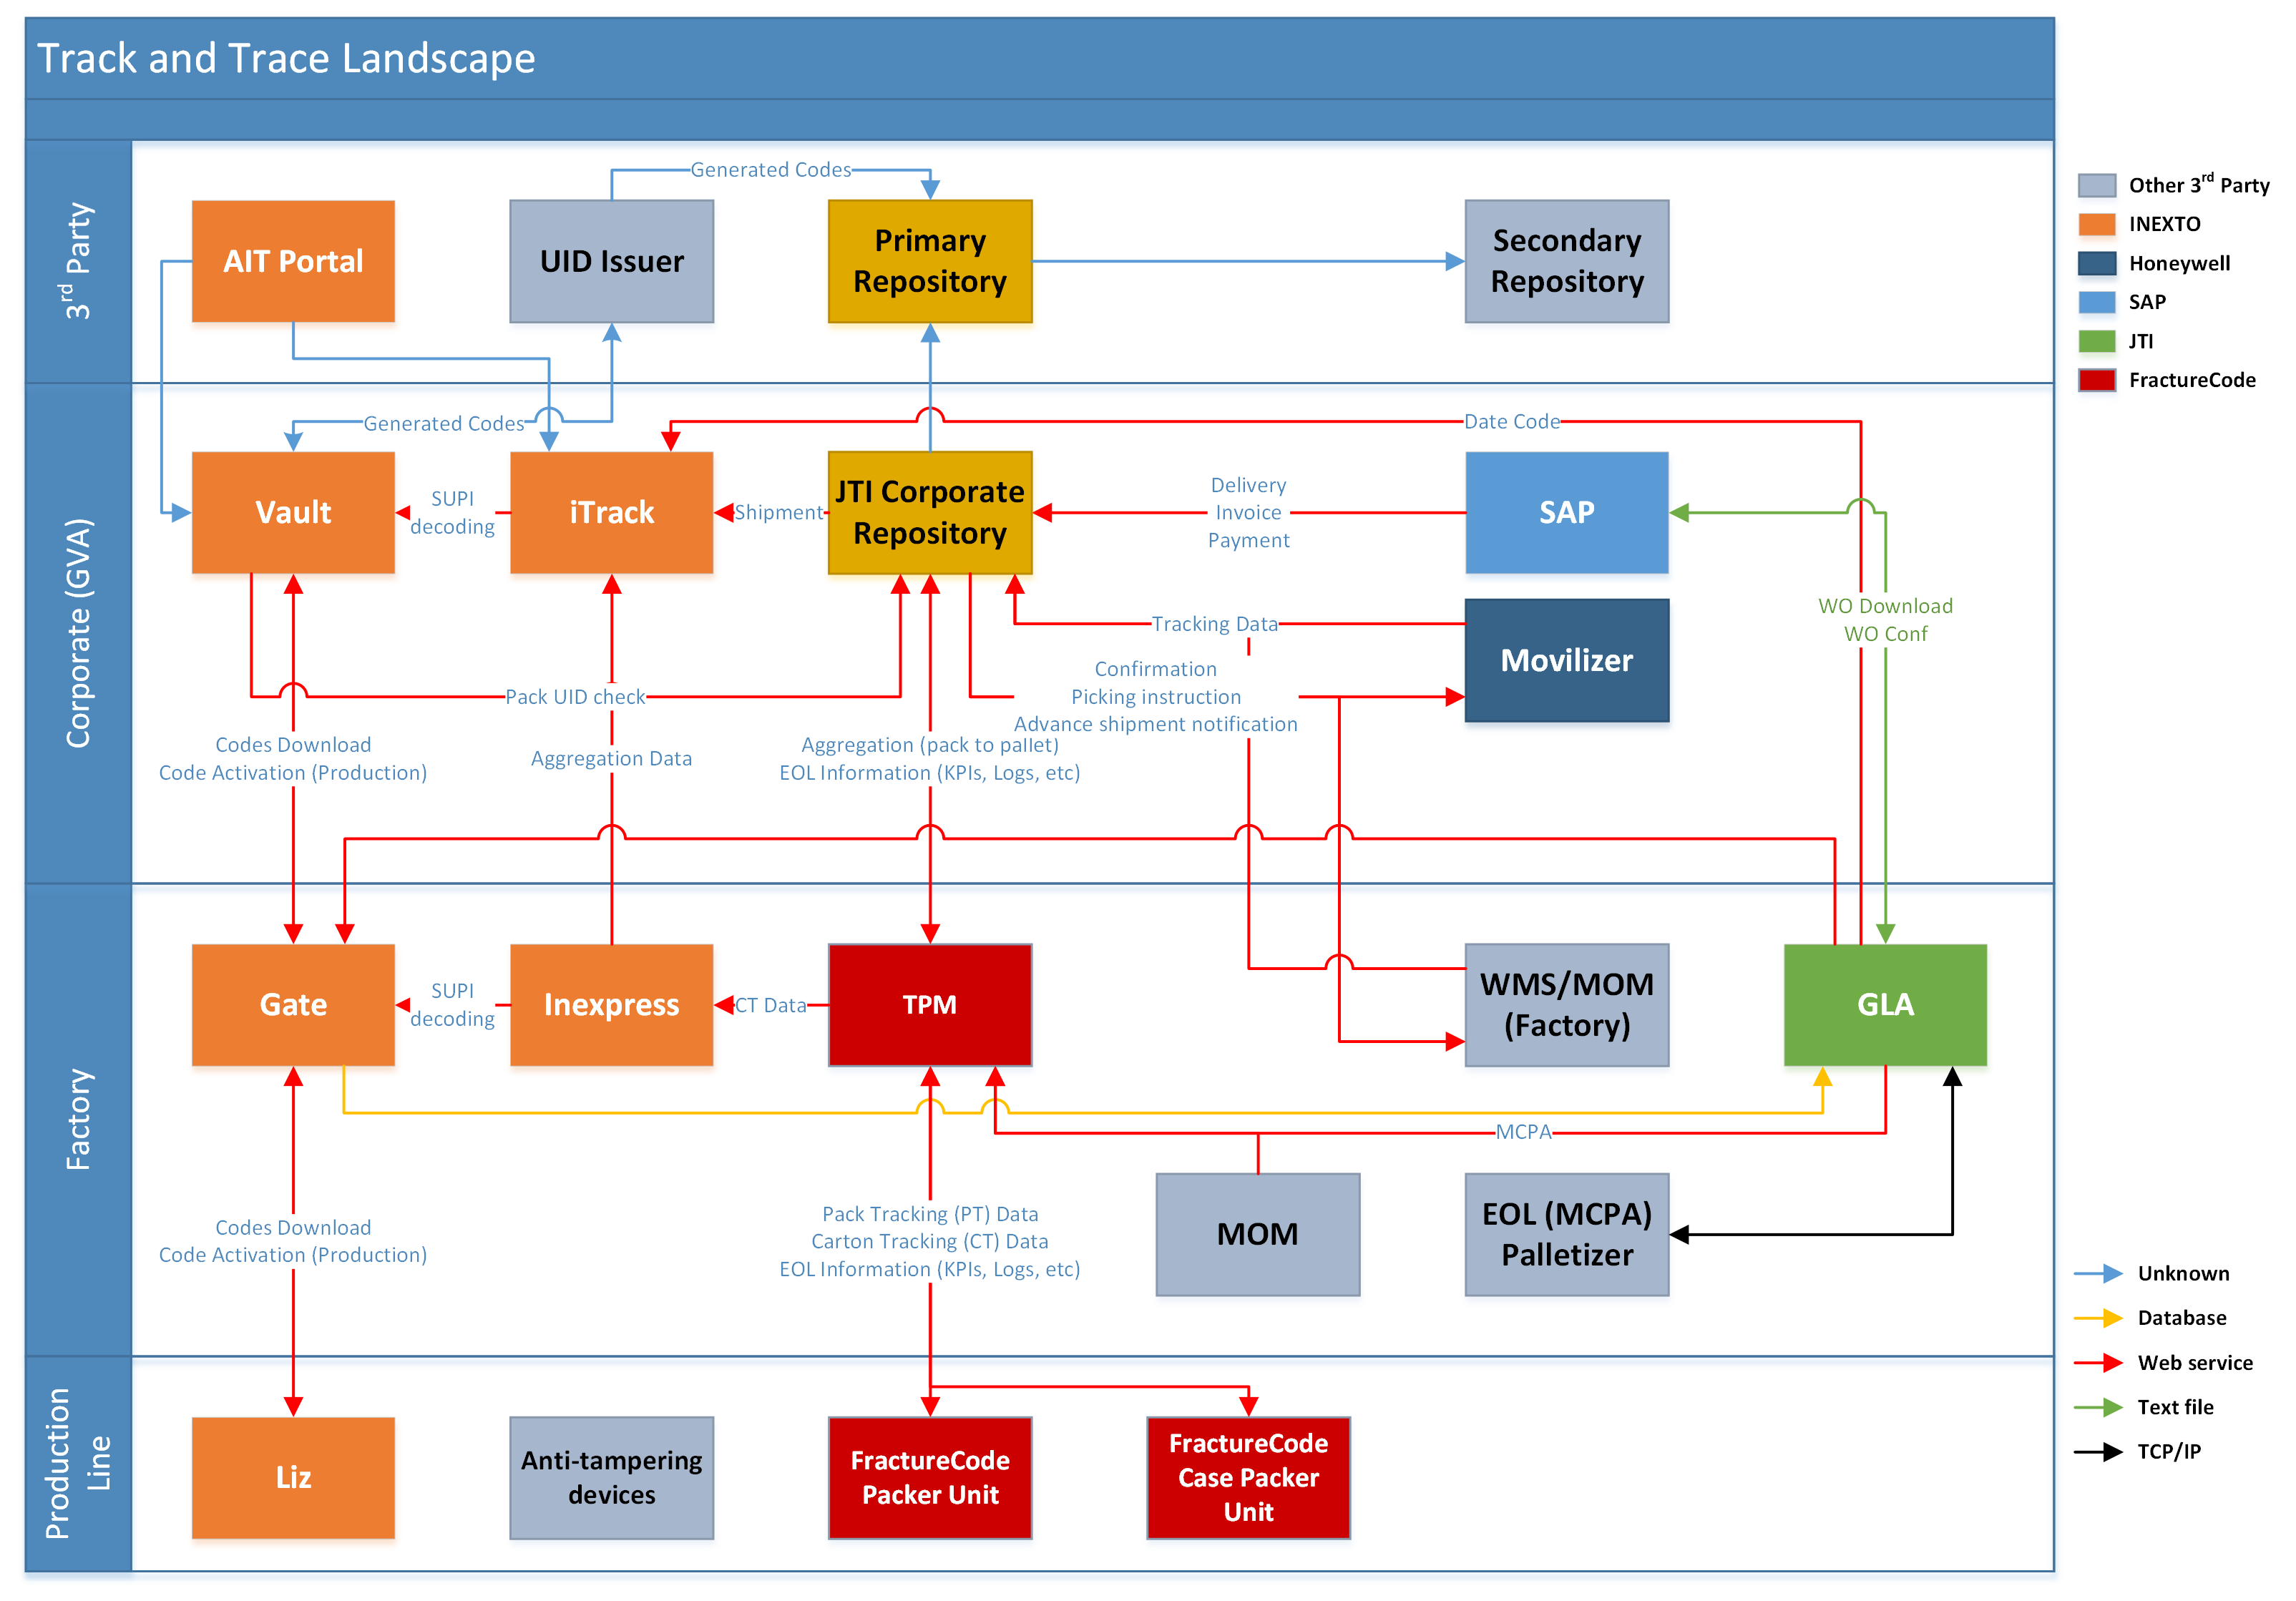
The landscape consists of applications, deployed: - on-premise in JTICORP network - provided as SaaS solutions, managed by external vendors
On-premise application may be based either on factories’ premises, or in Geneva datacenter, or in JTI Azure cloud extension
5.2 Monitoring scope
5.2.1 General consideration
For the JTI on-premise deployed application following level of monitoring will apply:
| # | Level name | Monitored details |
|---|---|---|
| 0 | Host level | CPU, RAM, and disk usage |
| 1 | Windows services monitoring | App and DB services status |
| 2 | Application-level monitoring | General metrics (like responsive time of UI), specific metrics (unique for each app) which confirm correct functioning of application workflow |
| 3 | UI(interface) level |
For the SaaS model application monitoring of general availability and application-level monitoring will apply.
5.2.2 T&T application in the scope of monitoring
Centrally-located services and applications:
-
JTI PRCheckTool
-
Tracy Bot
-
Common mailbox BUCTRACKT@jti.com
-
Inexto iTrack
-
Inexto Vault
-
SAP T&T Functionality for Production and Distribution
-
JTI Corporate Repository
-
Movilizer
-
Dentsu HUB
-
MoveIT
Factory-located services and applications:
-
Inexto LIZ
-
Inexto Gate
-
TPM
-
GLA
-
Inexpress
5.3 Monitoring metrics origination approach
All monitoring points will have corresponding CI. Alerts will be registered against these CIs. Links between CIs will be created to allow dependency analysis.
5.4 Monitoring visualization
Monitoring will provide the current status of the system.
The main page will show system status per location at a glance (the world map will be a more efficient view).
Following the level of aggregation will be applied for JTI on-premise deployed: Location – Application (TPM, GLA, etc) – Components (Services, DBs and so) & Connections – Host.
On the application level for each location used, global applications will be listed.
For the SaaS model applications, no level of aggregation should be applied.
5.5 Application Monitoring prerequisites
For each system, the IT owner will define a set of metrics that ensure the correct determination of system health. These metrics will be monitored and kept.
Also IT owner will provide the status of essential internal components/processes – green (ok) and red (not ok). If a specific internal component/process has been defined as an intermediate state, it will be provided as well.
List(s) of control (required functioning components/processes) to treat application is running fine.
A guideline to know how the list of controls should be checked.
5.6 Expected Monitoring status and prioritization
Aggregated status may be in one of these three types: Red (any of controls failed), Orange (any component, which is not in the list of controls failed), and Green (all components work correctly).
Maintain all dependent components of services.
Define for each component to be red/green and rules for status aggregation through all levels.
To define aggregated status the following prioritization should apply
From top to bottom:
-
Process correctness
-
Application health
-
Services and DB status
-
Host health
5.7 Incident registration
Based on alerts raised by a monitoring system, ITSP incidents should be created against respective CI for RCA and later tracking.
Alert should not affect system status as soon as conditions are revert to normal.
Maintenance mode will be implemented in order to properly handle planned downtime
5.8 Status follow-up policy
Follow-up should be performed based on incidents raised according to current support policy.
A monitoring team may be established to review the monitoring dashboard.
The monitoring dashboard should have common availability.
After component updates – the responsible team should observe the dashboard to review the overall impact on the T&T landscape.
5.9 Monitoring metrics accumulation
Monitoring metrics collected for each application should be stored for a period of at least 1 year at a centralized location. Collected metrics will be used for analytics, audit, and proactive maintenance planning.
Metrics history will be stored against CIs and their hierarchy.
6 Standard owner
Provide here information about the role who owns the standard
7 Document control
7.1 Contact person
Questions and feedback regarding this standard should be submitted to the Evdokimov Pavel
7.2 Revision History
| Version | Effective date | Purpose of change | Author |
|---|---|---|---|
| 1 | 01-Oct-2021 | First version of the document | Pavel Evdokimov |
8 References
ANY QUESTIONS?