Track and Trace Power BI Reports Documentation /
ITSP Data For BTS Track And Trace Reports
Incidents - IT Reports
Version: 1, effective date: 22-Feb-2023
Contents
1 Standard description
This document will define the reports & KPI’s for incident management.
2 Data Source
Reports from IT Service NOW.
Incidents: “(PowerBI source) BTS-QT - TrackAndTrace- INCs - Since last year” report, incidents with the following filters:
-
Configuration item contains “-TAT”
-
Created in the last 2 years
-
Incident Status is not “Rejected”
Change Requests: “(PowerBI source) BTS-QT - TrackAndTrace- CHG - Since last year” report, change requests with the following filters:
- Configuration item contains “-TAT”
- Incident Status is not “Closed Incomplete” and “Closed Skipped”
Incidents OPE-TT: “(PowerBI source) - TrackAndTrace- INCs-OPE-TT” report, incidents with the following filters:
- Business Service L2 is Operations Track and Trace (OPE-TT)
- Created after ’01-01-2021’
Locations: “(PowerBI source) BTS-QT - TrackAndTrace- Masterdata - Locations” report, locations with the following filters:
-
Level is 4
-
Full name does not contain “Microsoft”
-
Parent is not “ARCHIVE”
3 Refresh Schedule
Refresh frequency: Daily

Time zone: UTC + 01:00

Time: 11:00 AM

      13:00 PM

      15:00 PM

      19:30 PM
4 Content
Incident - IT PowerBI Reports contain 18 pages, 10 pages visible, 8 pages that can be accessed with Drill-through function or buttons from pages.
5 Pages
5.1 Key Figures
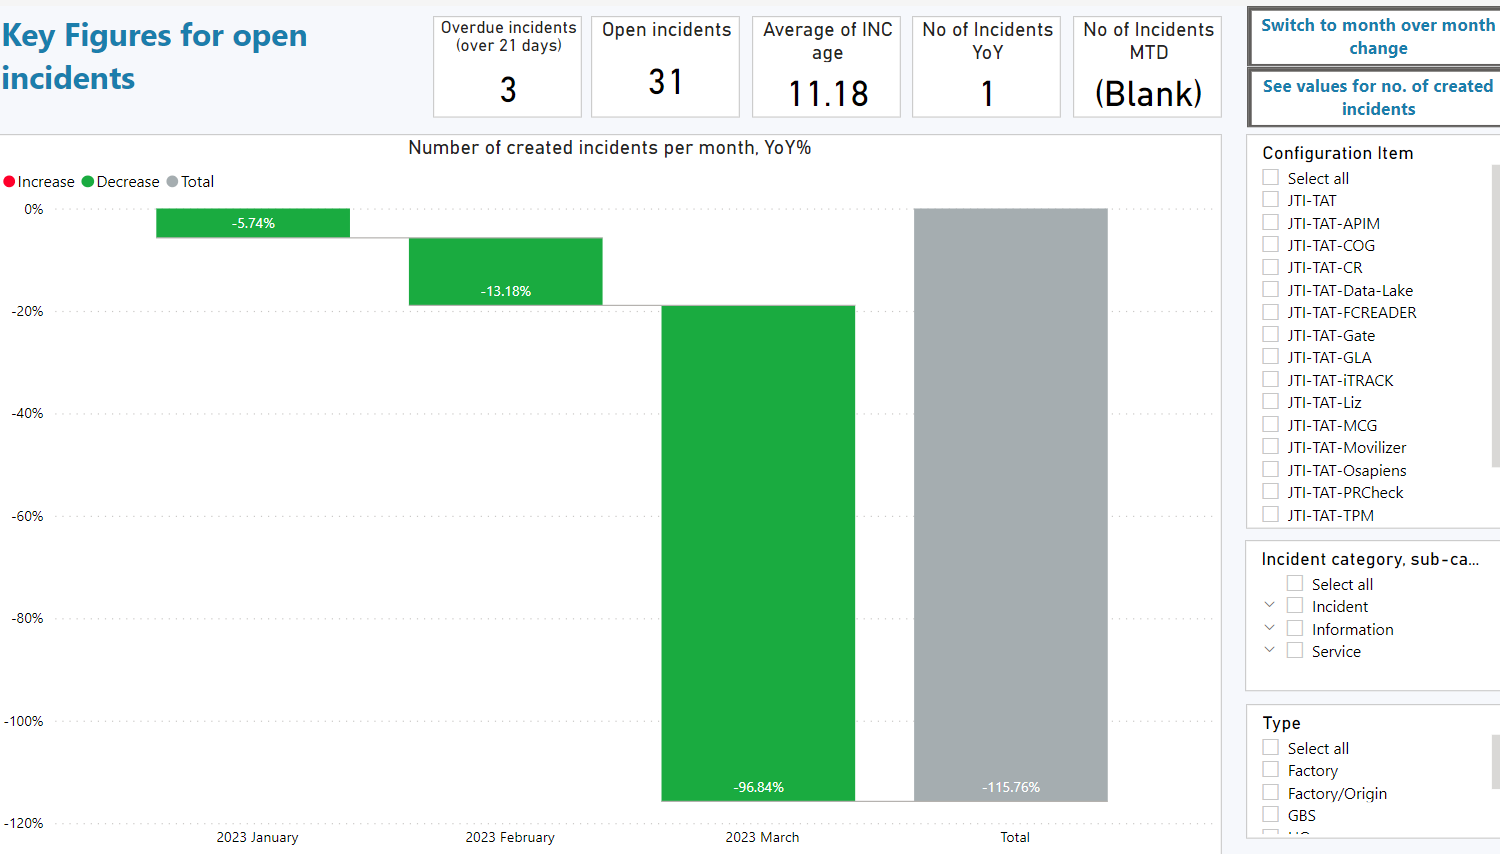
This page shows the information of key figures for open incidents on a yearly basis, number of created incidents month over month change and number of created incidents.
5.2 By CI
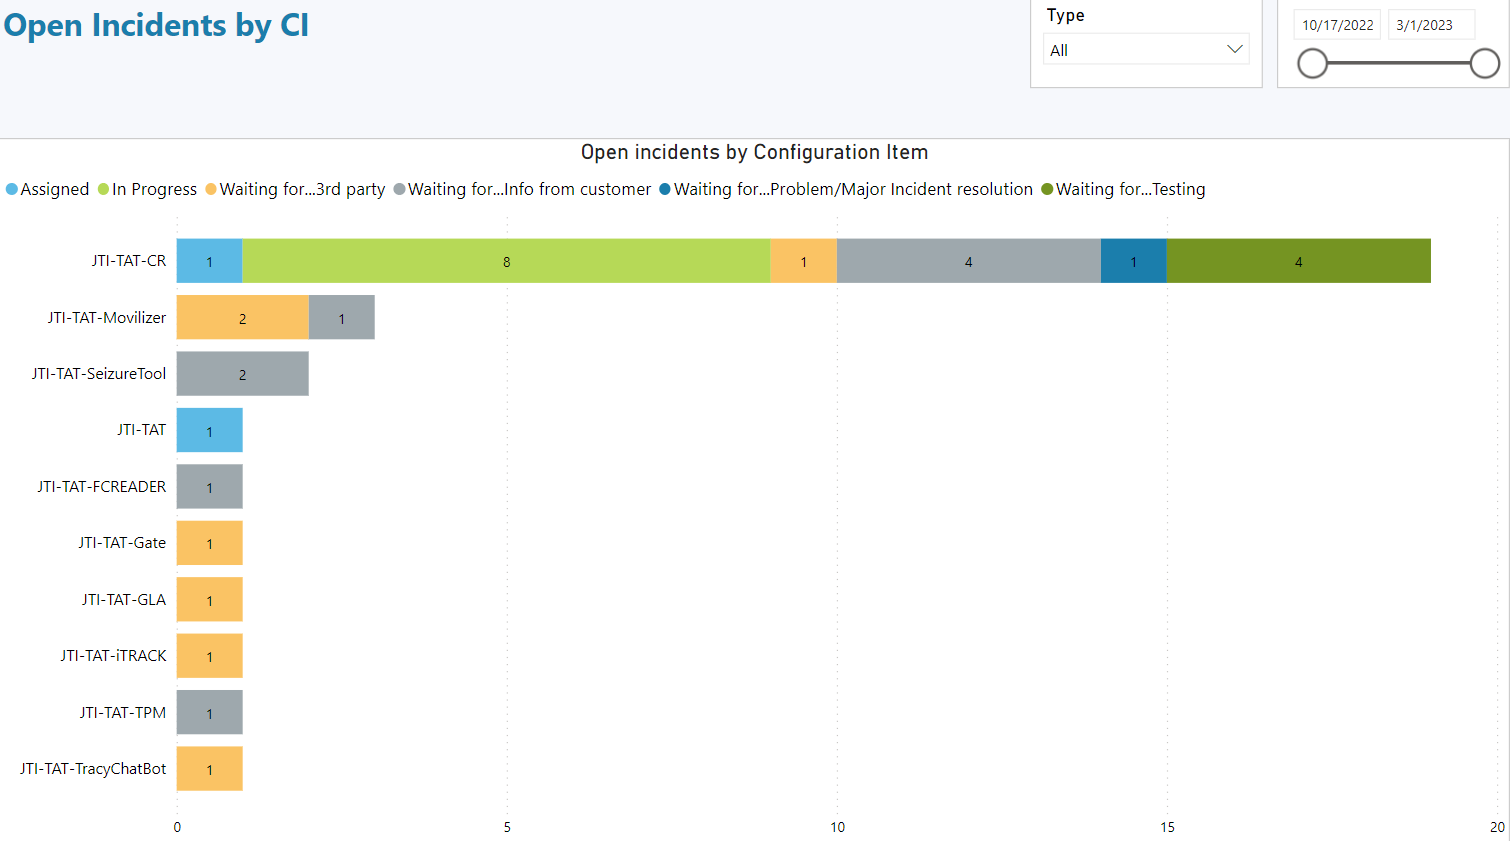
This page shows the open incidents by configuration items and state of the incident.
5.3 Overdue Incidents Over a Month
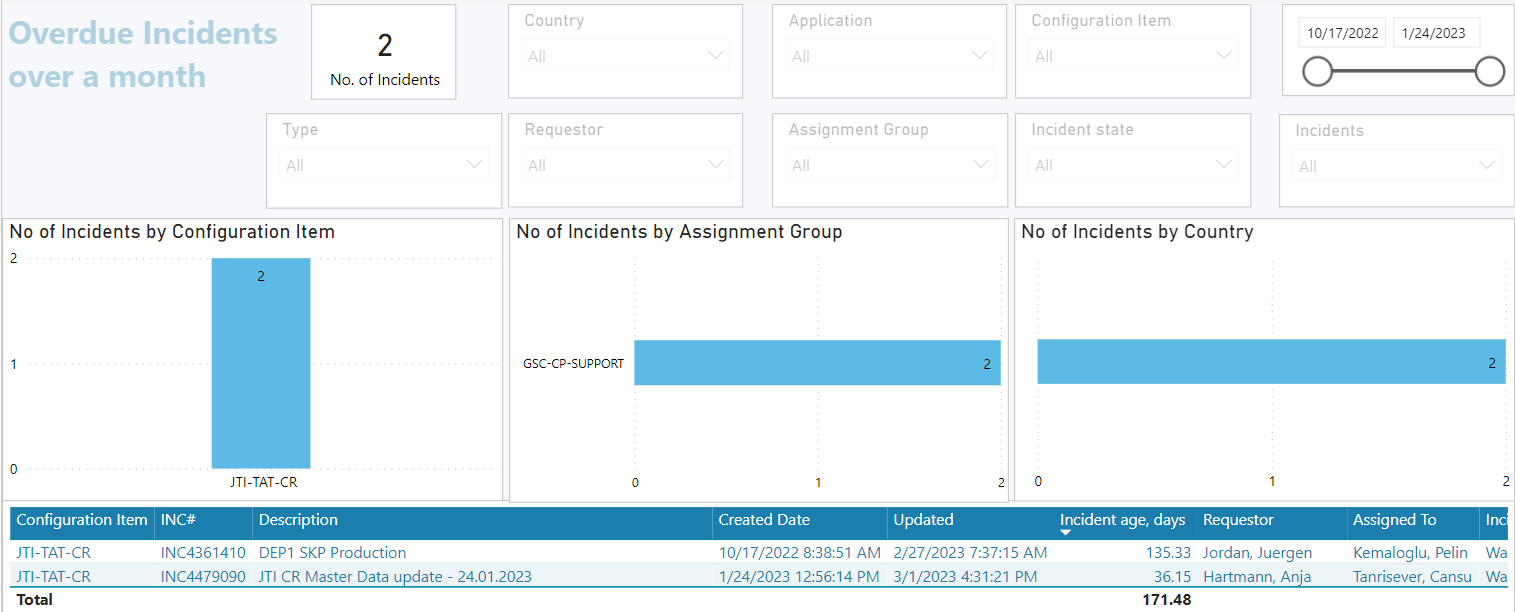
This page shows the incidents opened for more than 30 days by Configuration Item, Assignment Group and by Country. There are also details regarding the incident.
5.4 Incident Resolution Time
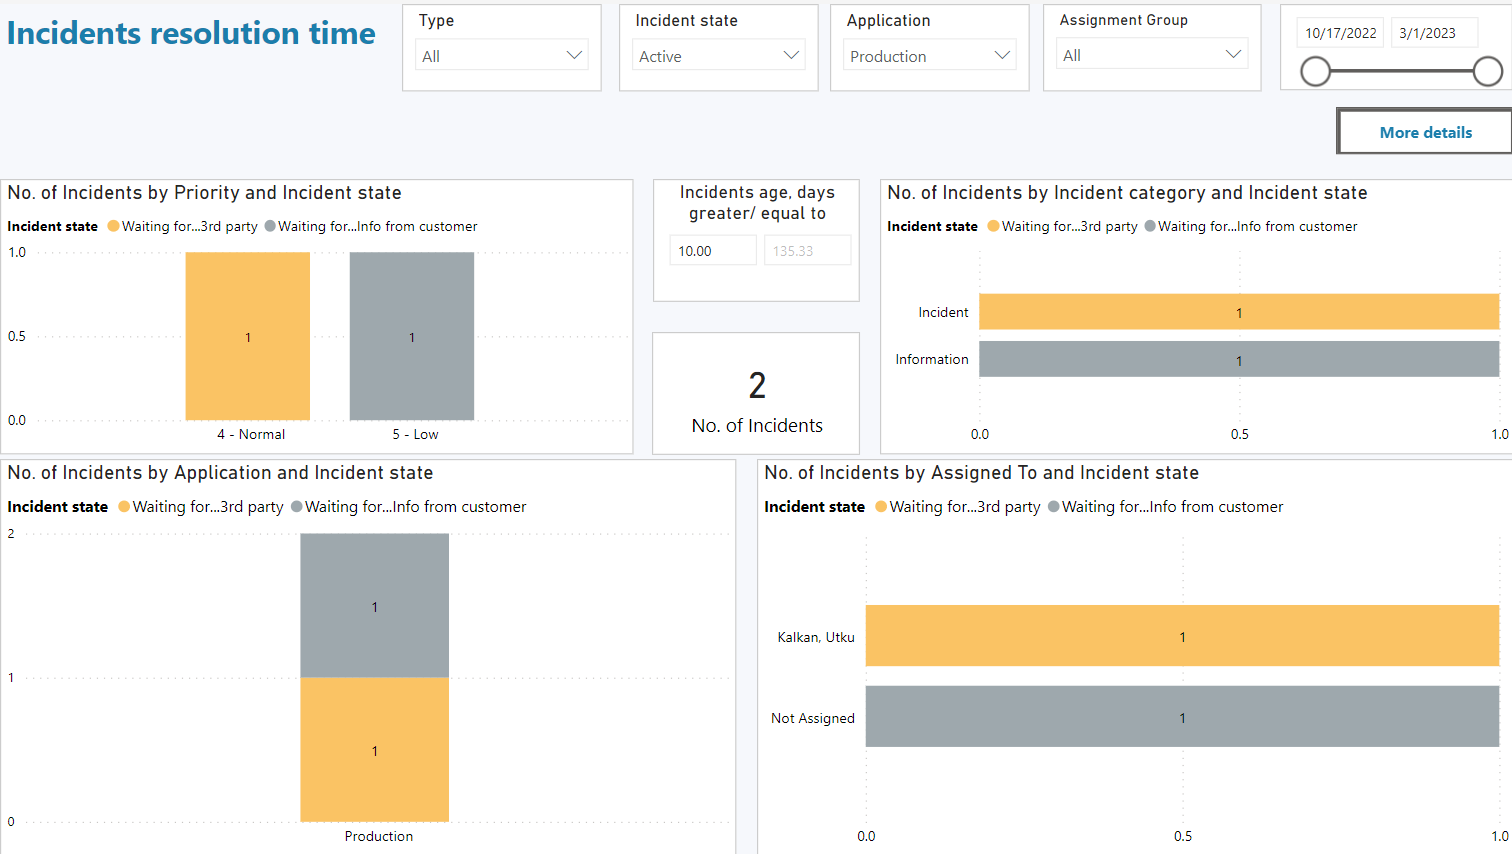
This page shows depending on the filter “Incident age, days greater/ equal to”, the graphs show number of incidents by Priority and State, by Category and state, by application and state and by assigned to and state. There is also the Drill- through function implemented in the graphs for more details regarding the incidents.
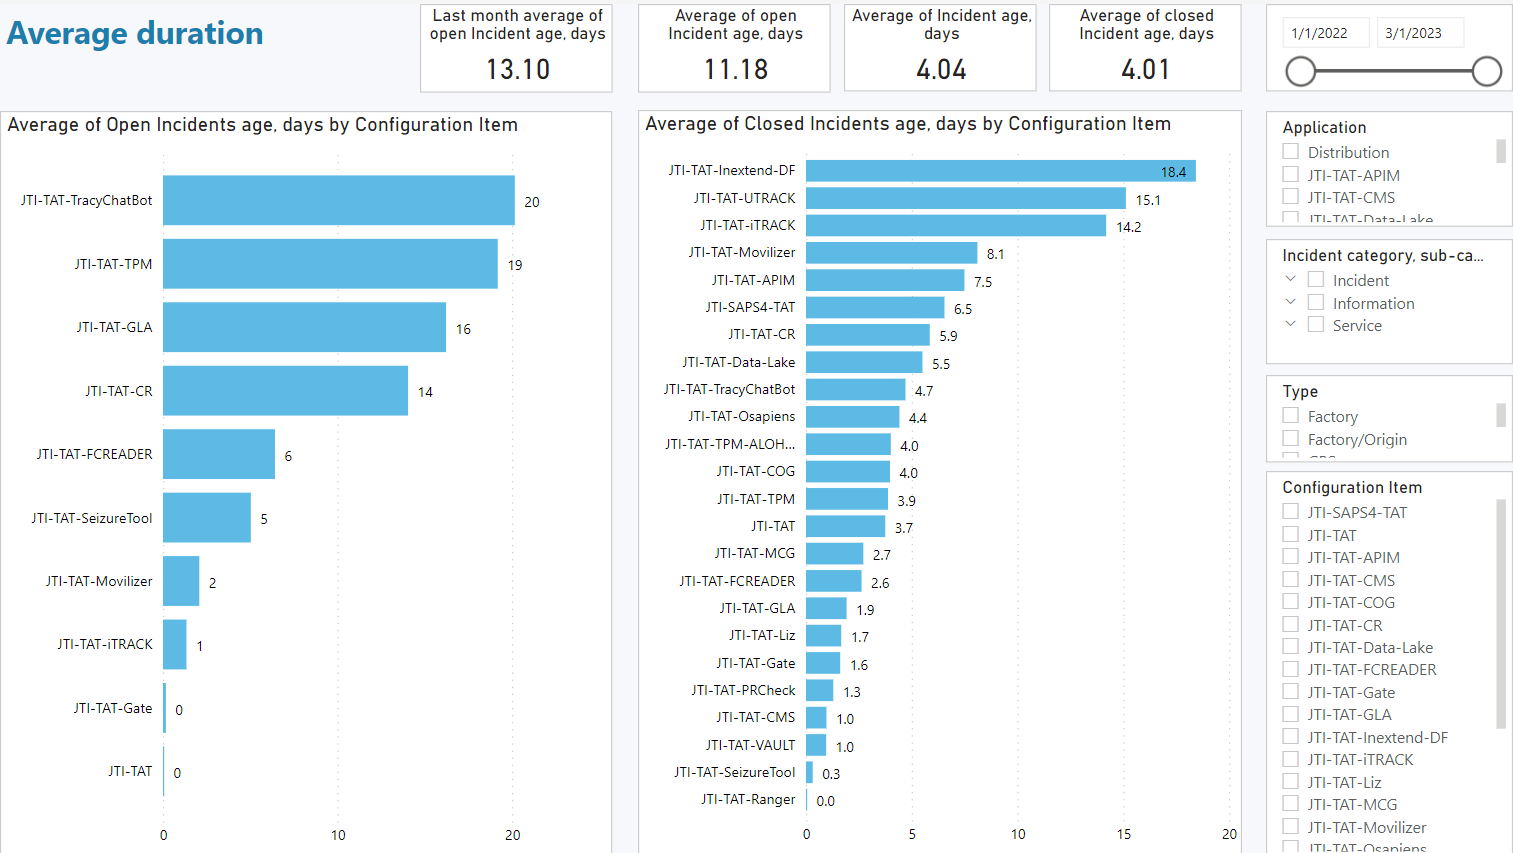
5.5 Average Duration
This page shows the information regarding the average duration of open and closed incidents by configuration item and age of the incident in days.
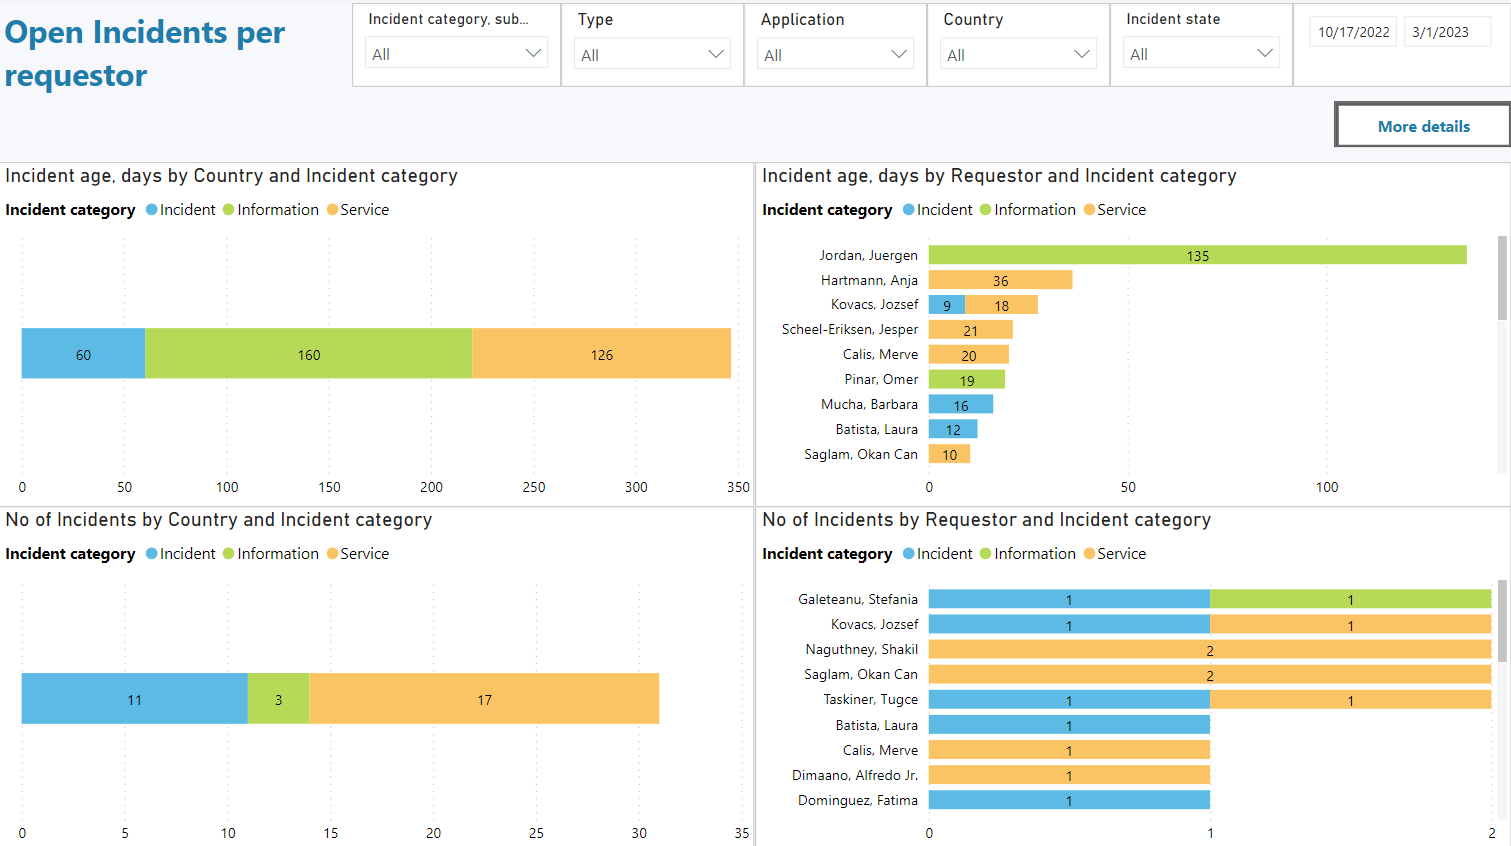
5.6 Open Incidents Per Requestor
This page shows the information of number of open incidents or incident age in days by country and category and by requestor and category.
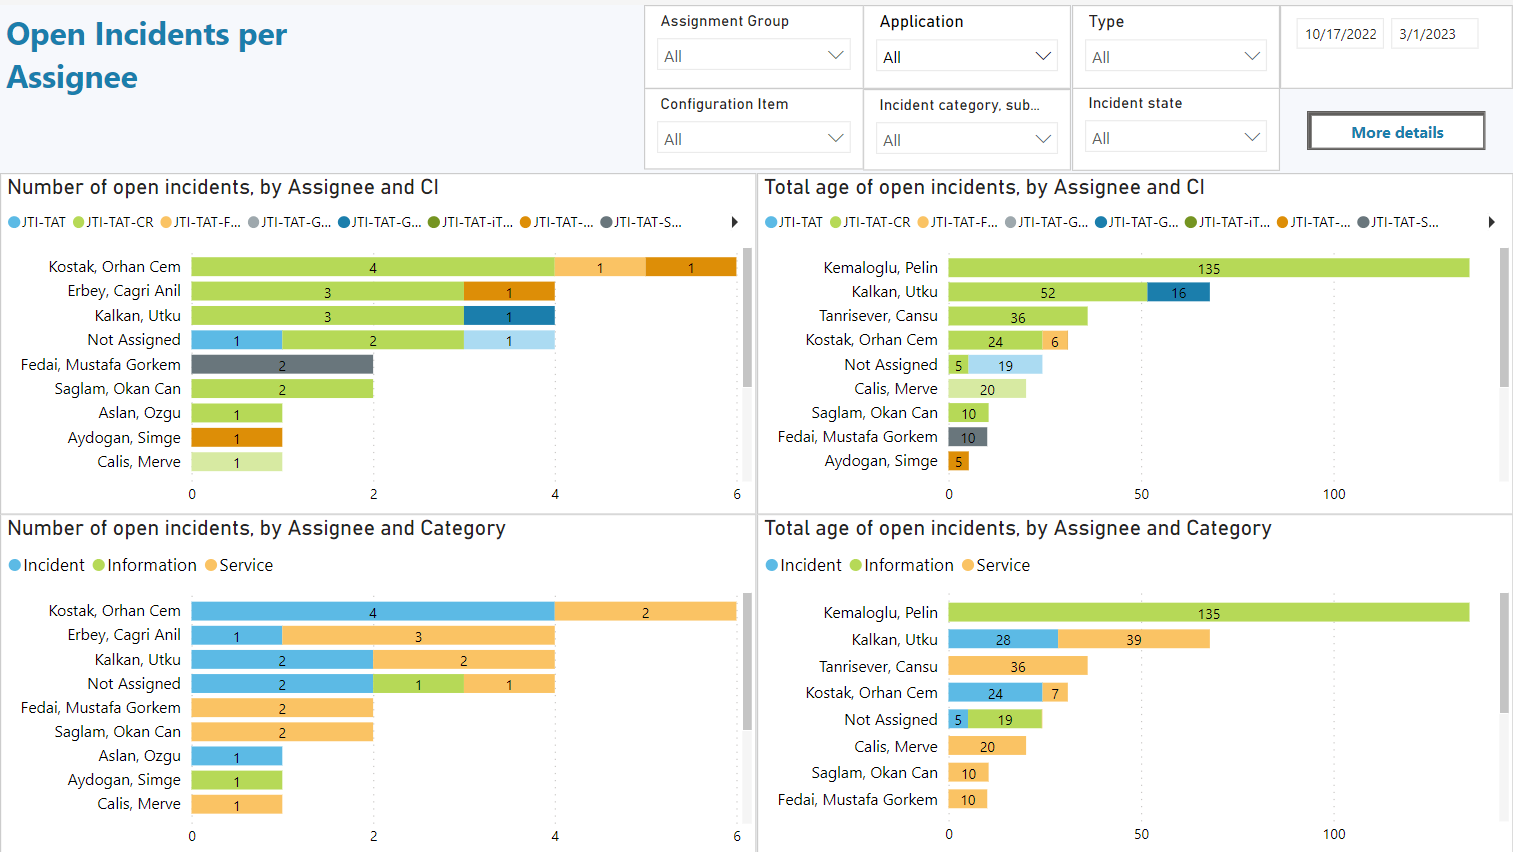
5.7 Open Incidents Per Assignee
This page shows the information of number of open incidents and incident age in days by assignee and category, assignee and configuration item.
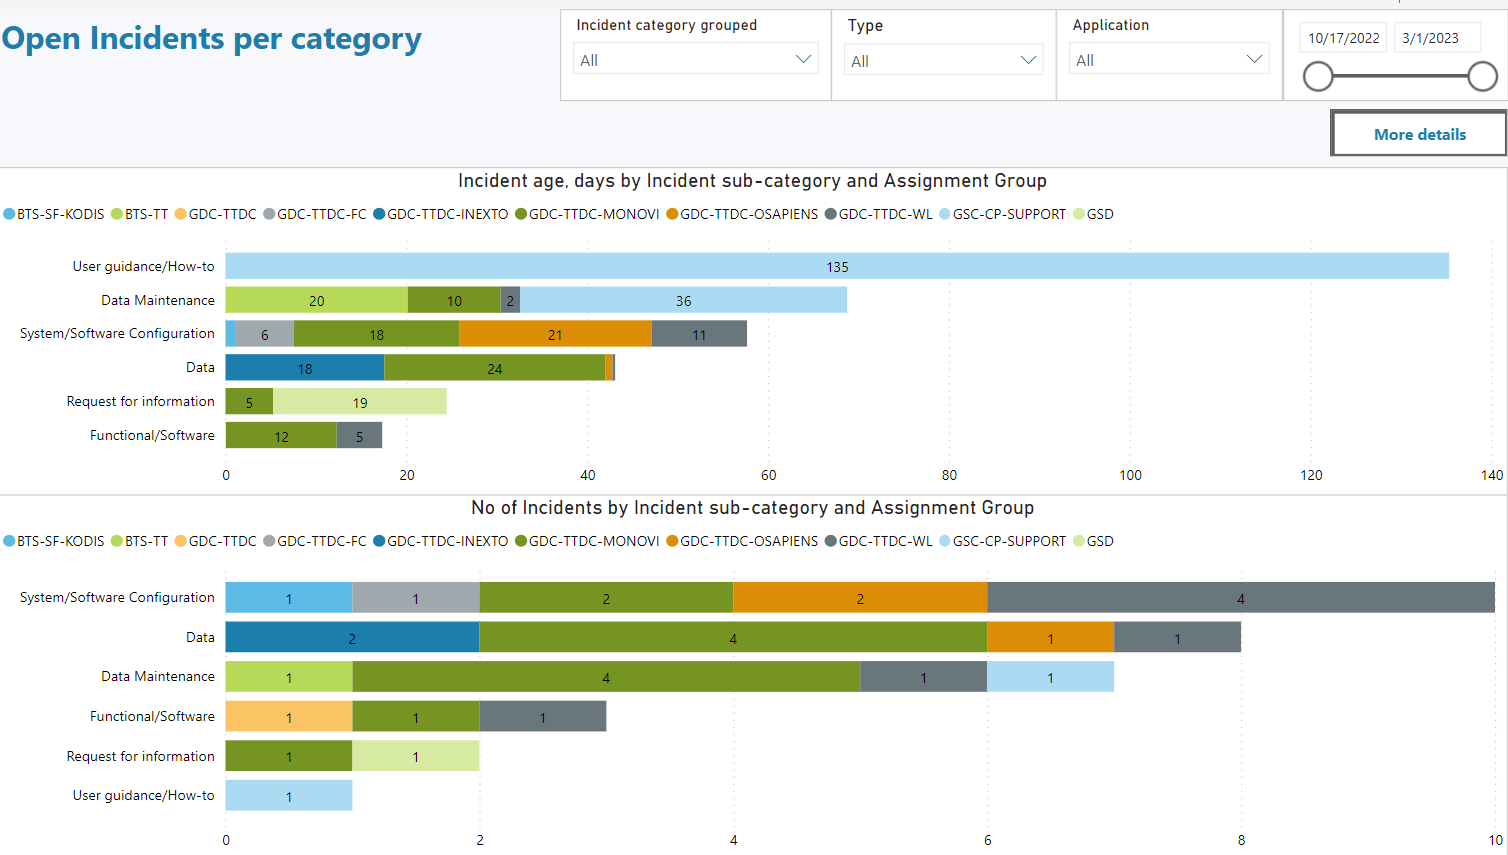
5.8 Open Incidents Per Category
This page shows the information of number of open incidents and incident age in days by sub-category and assignment group.
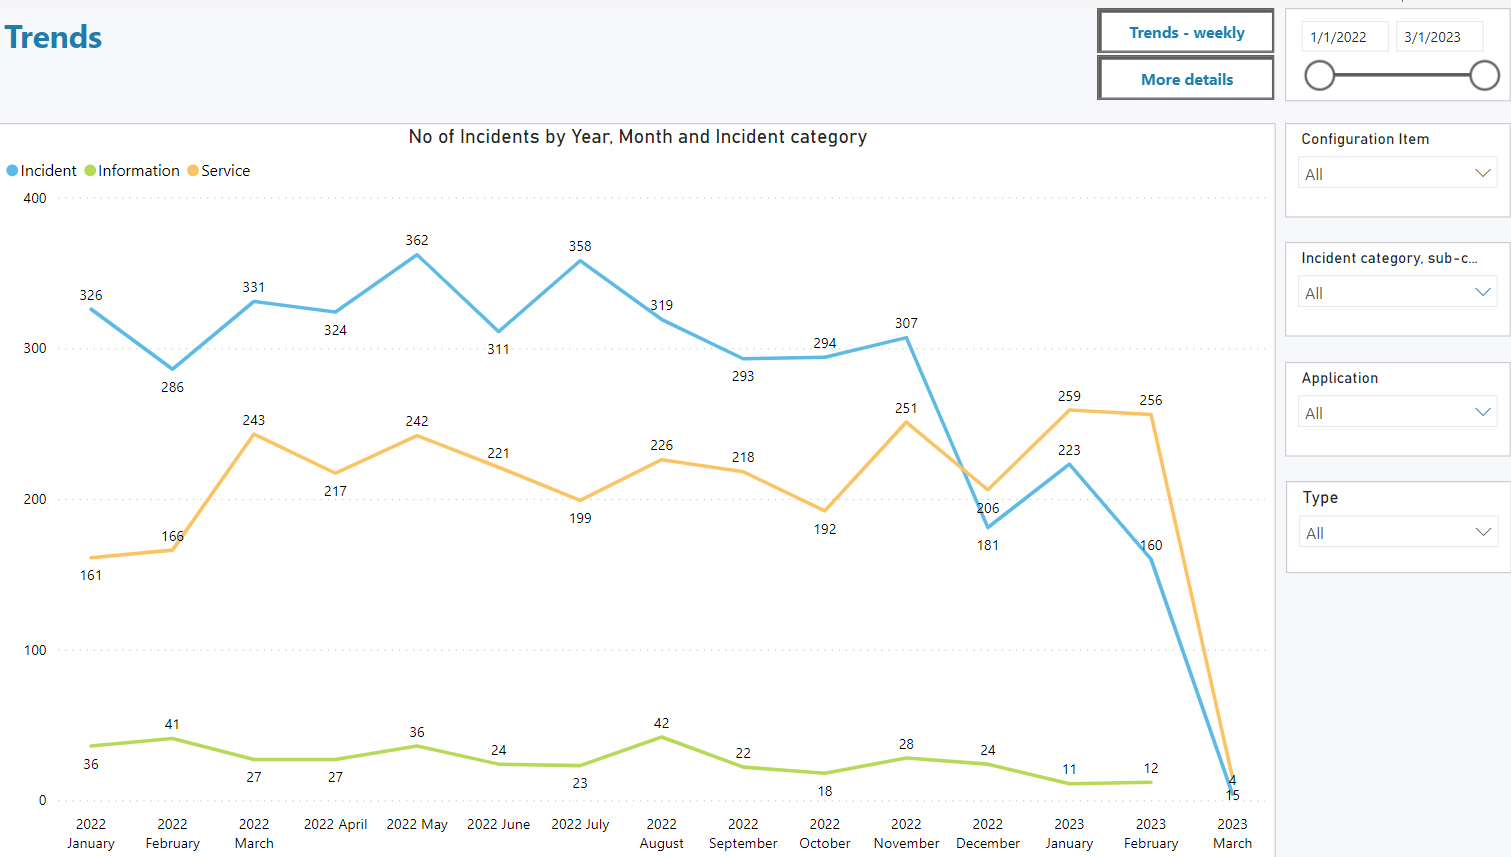
5.9 Trends
This page shows the number of incidents by year, month and incident category.
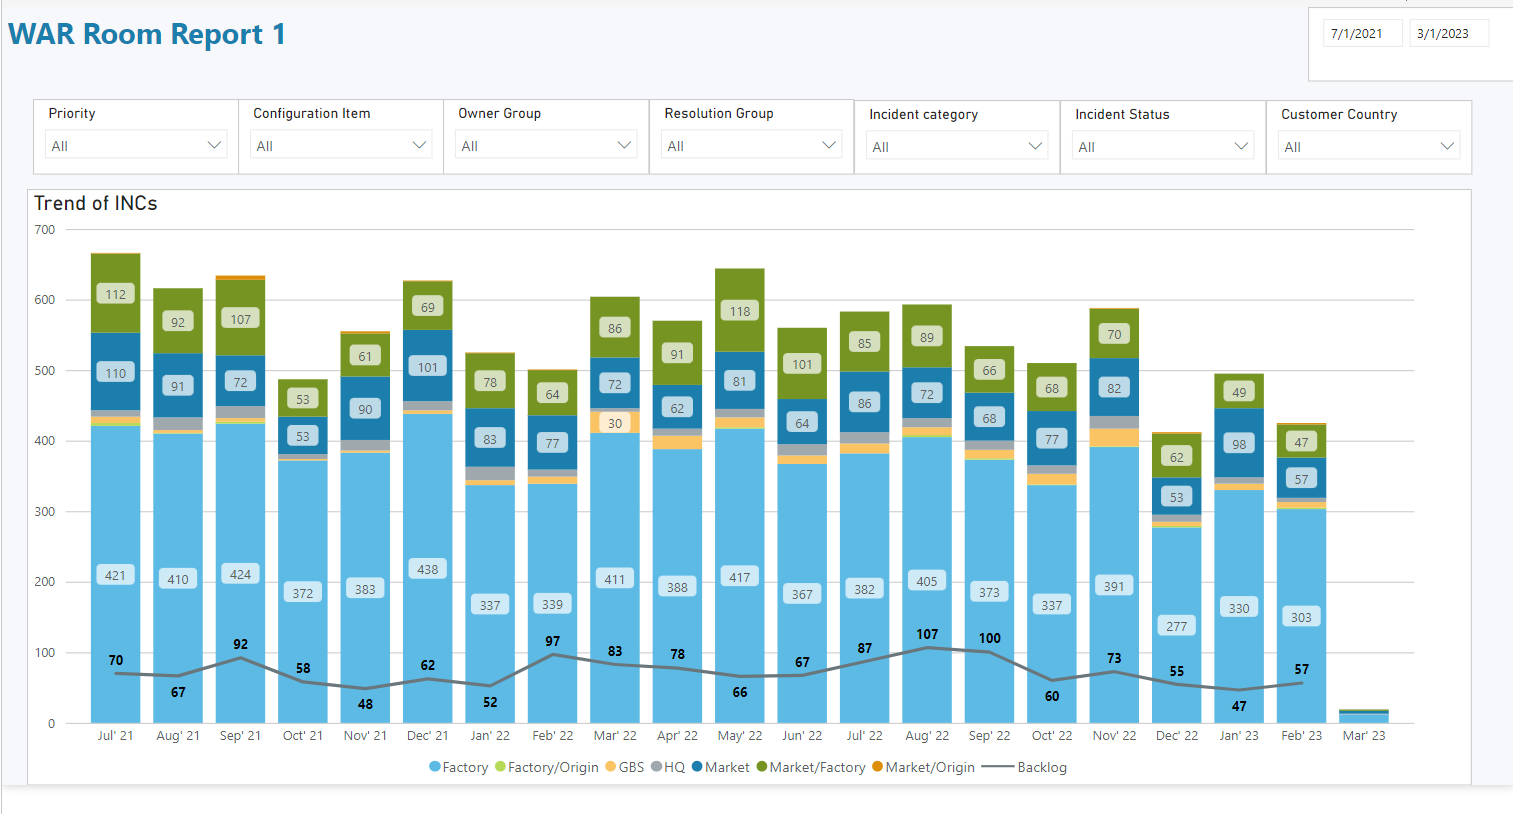
5.10 WAR Room Report 1
This page shows the number of created Incidents opened in IT SNOW for the period grouped by yearly, monthly, weekly. It should be grouped histogram + line graph. Grouped histogram should show number of tickets opened by Production + number of tickets opened by Distribution. Line graph – number of open tickets as average number of open tickets in the backlog during grouped period (year, month, week).
6 Document control
6.1 Contact person
Questions and feedback regarding this standard should be submitted to Alice Galoiu
6.2 Revision History
| Version | Effective date | Purpose of change | Author |
|---|---|---|---|
| 1 | 22-Feb-2023 | First version of the document | Alice Galoiu |
ANY QUESTIONS?