Track and Trace Reporting Standard
Version: 2, effective date: 20-Jun-2022
Contents
1 Standard description
This document will define the details of how to handle the T&T Reporting process.
2 Document objectives and benefits
2.1 Objectives
Objectives of this standard are:
- Defining the way of reporting that supports Track and Trace regulations
- Defining the process of initiation for T&T reporting using Power BI platform
2.2 Benefits
This standard enables a consistent way of reporting regarding Track and Trace requirements based on clear criteria and processes.
3 Definitions
| Abbreviation / Term | Explanation |
|---|---|
| T&T | Track and Trace |
Please refer to IT Glossary in the IT P&P portal for further definitions.
4 In the beginning
Prepare a description of feature reporting:
-
Define the types of data you need.
-
How often do you need to update data?
-
Attach an example of how the report should look.
-
Business reason or some short description about what purposes of report creating.
5 First step
- Raise demand or change request to the BTS team to ensure is it in the scope of T&T or maybe this report already exists.
- Provide details about your reporting to the responsible person of the BTS Team.
6 Technical requirements
6.1 Data from an on-premise database
6.1.1 Restriction
-
No direct queries – use DB’s VIEW for each query for reporting.
-
No DB-LINKS – manage additional access to each data source.
-
No personal access – use dedicated user for reporting purposes.
6.1.2 Allowance
-
Add VIEWs to the repo of the application – be ensure your VIEWs added to the release repository and will be deployed.
-
Grant access for reporting user – define service-account which one will have access to new VIEW.
-
Report must be IT supportable – ensure each report is well known by IT teams and support will be provided.
7 Reporting using Power BI
7.1 Introduction to Power BI Service
Power BI Service is a cloud-based application, which can be used for reporting and data analysis from a wide range of data sources. Power BI can be used in enterprise systems by BI developers for complex data mash-up and modeling scenarios and allows for combining and shaping data from multiple connections (SQL Server and Excel for example). The reports and dashboards created can be shared with others people inside the organization: data analysts, business analysts, and power users.
7.2 Introduction to Power BI Desktop
Power BI Desktop is the development tool/designer for building datasets and reports. Power BI Desktop is available as a stand-alone product that should be downloaded separately. It is updated monthly with new features and improvements. It is extremely important that all users who are going to collaborate on .pbix files are on the same version of Power BI Desktop.
7.3 Introduction to Power BI Gateway
Power BI Gateway is the connection between Power BI cloud-based dataset and the on-premises data source. Power BI allows only one gateway per report, even if the report has multiple data sources, they must be connected through a single gateway.
7.3.1 Add a data source
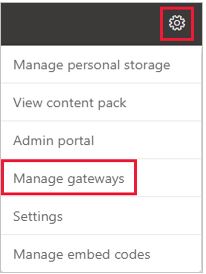
- From the page header in the Power BI service, select Settings gear icon > Manage gateways.
-
Select New at the top of the ribbon to add a new data source.
-
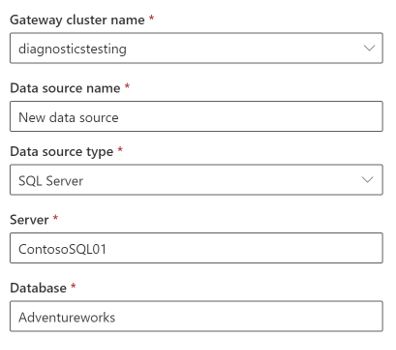
Choose the gateway you want to create the connection on, by providing the Gateway cluster name, then select the Data Source Type. In this example, we’ll choose SQL Server.
-
Enter information about the data source. For SQL Server, provide the Server and Database.
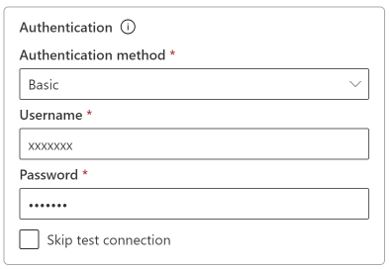
- Select an Authentication Method to use when connecting to the data source. For SQL Server, choose Windows or Basic (SQL Authentication). Enter the credentials for your data source.
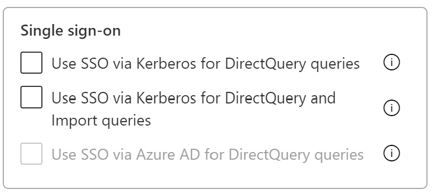
- Under Advanced settings, you could configure Single Sign-On (SSO) for your data source.
- Optionally configure the privacy level for your data source (doesn’t apply to DirectQuery).
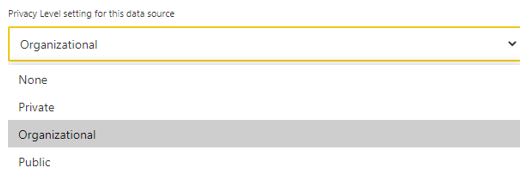
- Select Create. You see the new data source if the process succeeds.
7.4 Supported data languages
- Power Query formula language (M): transform and cleanup data, filter and combine data or create custom columns during data import.
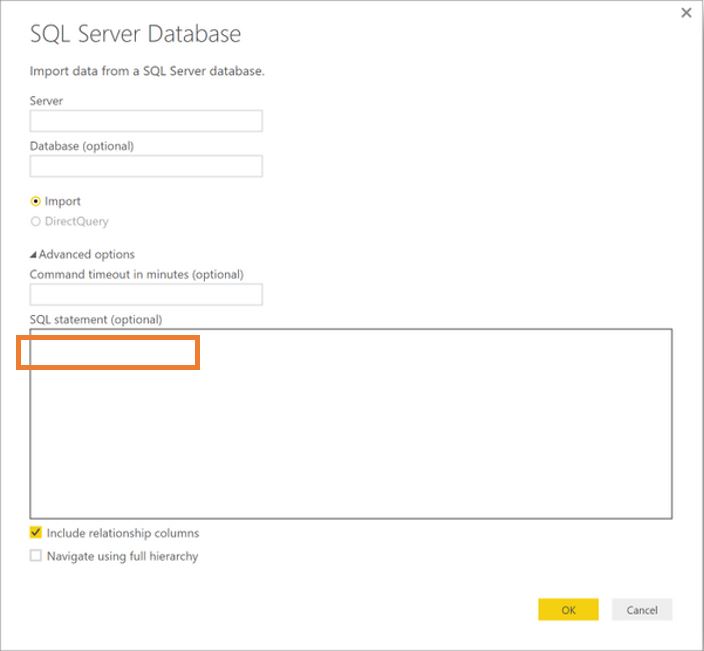
- SQL: used before the data import to pre-filter, join or transform the data
-
MDX: used before the data import, when querying SQL Server Analysis Services (SSAS).
-
Data analysis expression (DAX): define custom calculations in PB Desktop (calculated columns and measures).
-
R Script: used for loading and transforming data.
-
R Visual: used for additional enhancement and data visualization.
7.5 Power BI concepts
The five major building blocks of Power BI are: dashboards, reports, workbooks, datasets, and dataflows. They’re all organized into workspaces, and they’re created on capacities. It’s important to understand capacities and workspaces before we dig into the five building blocks, so let’s start there.
7.6 Datasets
A dataset is a collection of data that you import or connect to. Power BI lets you connect to and import all sorts of datasets and bring all of it together in one place. Datasets can also source data from dataflow.
One dataset:
- Can be used in one or in many workspaces.
- Can be used in one or in many different reports.
Datasets can be refreshed, renamed, explored, and removed.
Users would develop .pbix Power BI Desktop files and publish them to the Power BI Service. After publishing the dataset to PB Service, automated data refresh can be scheduled via the Power BI gateways.
If a dataset is re-published from Power BI Desktop, all the properties (for example Scheduled refresh) and reports containing data from that particular dataset will still be available.
If a dataset is deleted, all the reports and dashboard tiles containing data from that dataset will also be deleted.
If a report is deleted, the dataset behind the report will still be available.
7.6.1 Considerations and Limitations
-
Dataset size limit - there is a 1 GB limit for each dataset in the Power BI service.
-
Row limit - the maximum number of rows in your dataset when using Import is 2 billion, with three of those rows reserved (resulting in a usable maximum of 1,999,999,997 rows).
-
The maximum number of rows when using DirectQuery is 1 million rows.
-
Column limit - the maximum number of columns allowed in a dataset, across all tables in the dataset, is 16,000 columns. This applies to the Power BI service and to datasets used in Power BI Desktop. Power BI uses an internal row number column per table included in the dataset, which means the maximum number of columns is 16,000 minus one for each table used in the dataset.
-
Dataset size refresh limitation: 10 GB of uncompressed data.
!!! Optimize the dataset to avoid issues with data refresh by:
-
Removing the columns that are not used
-
Reducing the use of highly repetitive, long string values and instead using normalized keys
-
Aggregate data at the minimum grain required for reporting purposes
7.7 Reports
A Power BI report is one or more pages of visualizations or visuals (tables, matrix, charts and graphs, maps, cards, KPIs, tree maps and more). All the visualizations in a report come from a single dataset.
Power BI service has two different modes for interacting with reports:
- Reading mode for report consumers (read-only users)
- Editing mode for report owners and creators.
One report
-
Is contained in a single workspace.
-
Can be associated with multiple dashboards within that workspace (tiles pinned from that one report can appear on multiple dashboards).
-
Can be created using data from one dataset.
Users can personalize a report or a dataset without affecting the original content by creating a new item using the “save as” option for an existing report and then customize it for their own purposes.
7.8 Dashboards
A Power BI dashboard is a single page, often called a canvas, that tells a story through visualizations. Because it’s limited to one page, a well-designed dashboard contains only the highlights of that story. Readers can view related reports for the details. It is created in Power BI service.
Dashboards can be created by adding elements from existing reports:
- Entire report pages can be pinned to a dashboard as a single tile using Pin Live Page.
- Each Visual element from report pages can be pinned individually using Pin visual.
One dashboard:
- Is associated with a single workspace.
- Can display visualizations from many different datasets or reports.
Why do we create dashboards?
-
To see, in one glance, all the information needed to make decisions.
-
To monitor the most-important information and metrics.
-
To ensure all colleagues are on the same page, viewing and using the same information.
-
To monitor the health of a business or product or marketing campaign etc.
7.9 Workspace
Workspaces are places to collaborate with colleagues to create collections of dashboards, reports, datasets, and paginated reports. There are two types of workspaces:
- My Workspace is the personal workspace for any Power BI user to work with their content. Only you have access to your “My workspace”, hence these are not good if the content should be shared.
- App Workspaces (also called Workspaces or Group Workspaces) are used to collaborate and share content with other users. The workspace admin can add other users to an App Workspace and collaborate on dashboards, reports, workbooks, and datasets.
App Workspaces are also the places where you create, publish, and manage apps for your organization. We can think of them as staging areas and containers for the content that will make up a Power BI App.
Workspaces in Power BI allow for multiple users to “co-author” reports and share ownership over the Power BI content. Content into Workspaces can be added from Power BI Service or can be published via Power BI Desktop.
After you create a .pbix file into Power BI Desktop, you can publish it into an existing Workspace, so every member in that workspace can collaborate on it.
In Power BI Desktop, select Publish on the Home ribbon, then in the Select a destination box, click on the desired Workspace.
A Workspace can be created either Public or Private:
- Public: anyone in your organization can see what’s in the workspace.
- Private: only the members added in the workspace can see its contents.
A workspace has two types of users: Admins and Members.
Admin users can:
-
Add new members or remove existing members, including making a workspace member an admin.
-
Make changes to the content (edit reports, dashboards, and datasets).
-
Edit the App Workspace name.
-
Delete the App Workspace.
For Members there are two levels of access that can be applied (read-only and edit):
- Members can only view Power BI content:
-
This is the “read-only” option.
-
This option disables editing mode on deployed reports and dashboards for members, so only Admin users within the workspace will be able to edit reports and dashboards.
-
The dataset area will not visible, which will prevent the creation of new reports by the members.
- Members can edit Power BI content:
-
This option allows editing on deployed reports and dashboards for members.
-
The dataset area is visible to members and they can create new reports.
Only a single option can be selected for the whole workspace and it will give to all the added members the same rights.
8 Document control
8.1 Contact person
Questions and feedback regarding this standard should be submitted to Ivan Panov
8.2 Revision History
| Version | Effective date | Purpose of change | Author |
|---|---|---|---|
| 2 | 20-Jun-2022 | Reporting using Power BI section had been added. | Alice Galoiu |
| 1 | 19-Apr-2022 | First draft of the document | Seval Altug |
ANY QUESTIONS?